
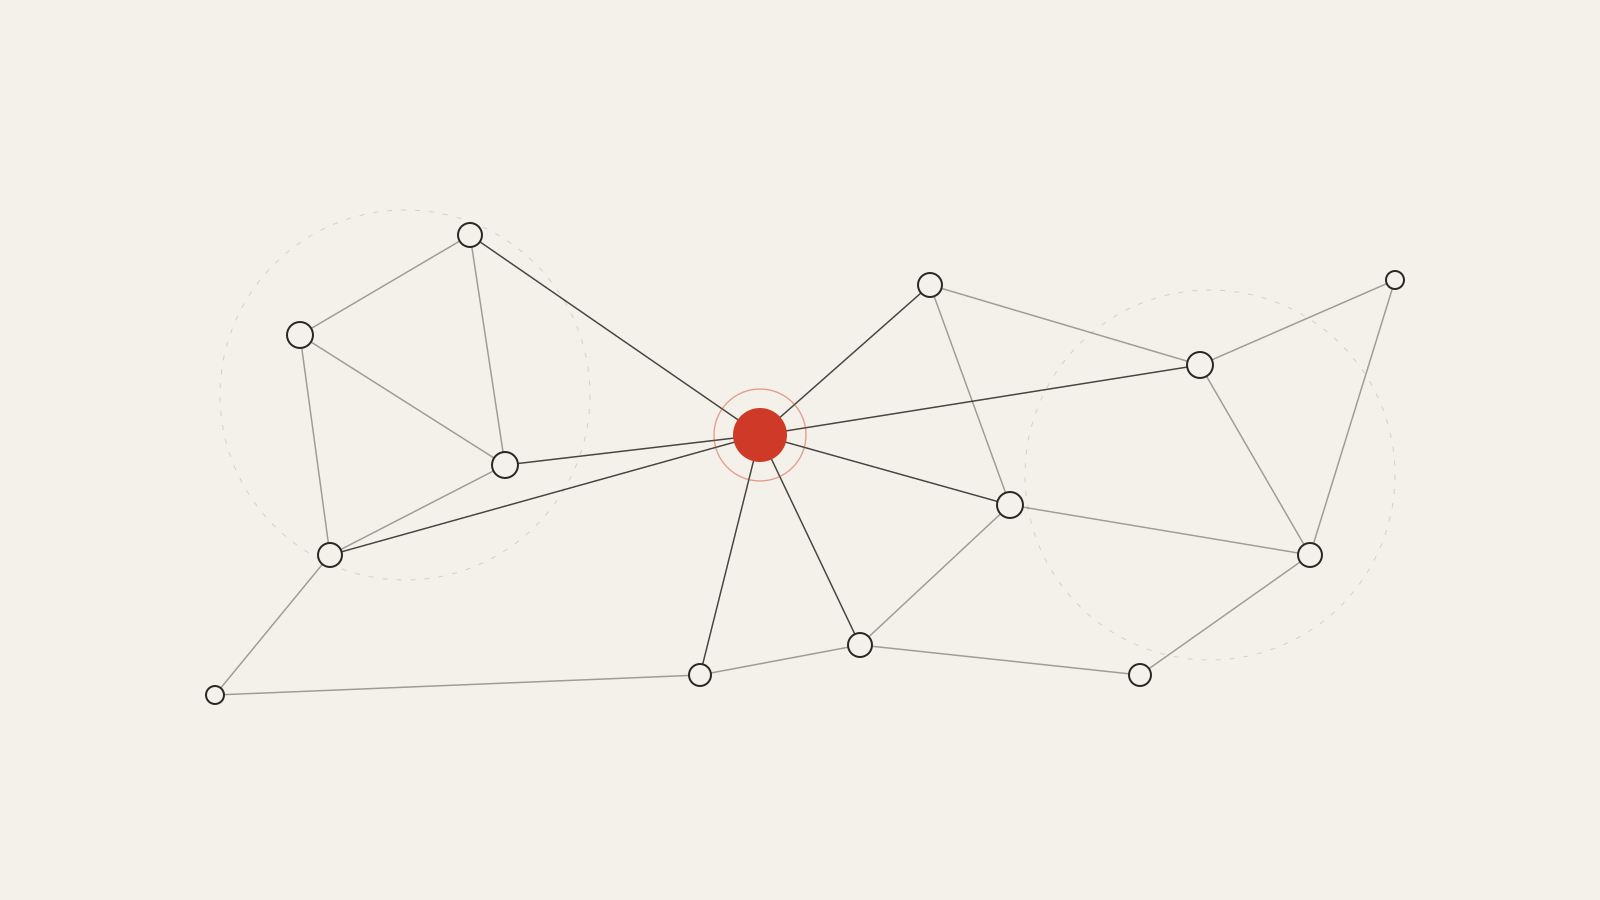
109,000 stars in four months, zero LLM credits to index, and a first-party benchmark that is reproducible and ships with its own spend ledger. That is the merit. And sitting in that same table is the row that dismantles the headline.
What it actually is
Graphify takes a repository — code, SQL schemas, Terraform, MCP config, documentation, PDFs, images, video — and turns it into a queryable knowledge graph. The idea is that your coding assistant asks the graph instead of grepping through files and mentally rebuilding the relationships every session.
Nothing new so far: code indexes are a crowded field. What makes Graphify interesting is the thesis, which is explicitly anti-vector. No embeddings. No vector store. Deterministic tree-sitter AST extraction, community detection by graph topology, and path tracing. The README says it in those words: no embeddings, no vector store.
The context numbers, as of 22 August 2026: 109,000 stars and 10,600 forks, 1,520 commits on the v8 branch, 216 releases from the first one (0.1.1, on 4 April 2026) to 0.9.48 on 20 August, and roughly 5.58 million cumulative PyPI downloads, about 2.09 million of them in the last thirty days alone. Graphify Labs is a US company backed by Y Combinator (S26). The project is four months into public life.
One practical detail before we go on: the PyPI package is called graphifyy, with a double “y”. The command is still graphify. There are unrelated graphify* packages on PyPI, so if this goes into a manifest, pin the exact name.
The pipeline: seven pure functions and three passes
The architecture is remarkably boring, and that is a compliment. Seven chained functions communicating through Python dicts and NetworkX graphs, no shared state, no side effects outside graphify-out/:
detect() → extract() → build_graph() → cluster() → analyze() → report() → export()detect() classifies each file. extract() is where the work lives: 37 tree-sitter grammars, plus regex-based Apex, HCL, SQL schemas and live PostgreSQL introspection, package manifests and MCP configs. build_graph() assembles nodes and edges. cluster() runs Leiden. analyze() looks for god nodes — the disproportionately high-degree nodes, which are usually exactly where it hurts to touch anything. report() and export() write the three artifacts: graph.json (NetworkX node-link), GRAPH_REPORT.md (human-readable) and graph.html (force-directed visualization).
But the architectural decision that really matters is a different one: the split into three passes, because it is what determines which data leaves your machine.
The code pass is 100% local and deterministic. It calls no model, needs no API key and never touches the network. The audio and video pass transcribes locally with faster-whisper. The third one — documentation, PDFs, images — does need a model, and it is the one that breaks the local-first label. Run with --code-only and the first pass is the only one that executes. Zero network, zero cost, zero data exposure.
That asymmetry is the product. Everything else is optional.
Determinism instead of similarity
Three design decisions worth taking one at a time.
Topology as the signal. Leiden clusters nodes by edge density. There is no embedding step: “similarity” between two parts of the system is not cosine distance between vectors, it is how many paths connect them. That is a strong bet, not a shortcoming. And it has a property vector indexes do not: it is reproducible. Same commit, same graph.
With one caveat worth stating, because the absolute version of the slogan does not hold: the pipeline uses no embeddings, but the benchmark harness does — it uses a local BGE-m3 embedder, and there is an alternative SurrealDB-engine configuration. The accurate claim is “the index carries no embeddings”, not “there is not a single vector here”.
First-class hyperedges. Group relations — the ones involving three or more nodes — live separately in G.graph["hyperedges"] instead of being decomposed into pairwise edges. That is real n-ary modelling, and it is rare in this segment. When you decompose a ternary relation into three binary ones, you lose the information that they were the same thing; here you do not.
Hash-based cache and a version-controlled graph. The cache is per-file SHA-256: unchanged content is never re-extracted. And graphify-out/ is designed to be committed to the repository, with a merge driver that union-merges graph.json and a post-commit hook that rebuilds the AST layer at zero API cost. The graph stops being an ephemeral artifact on your laptop and becomes something you review in a pull request.
On top of that sits a working-memory layer that is, to me, the most original part of the design: graphify save-result records the outcome of each question (useful / dead_end / corrected) and graphify reflect aggregates those into reflections/LESSONS.md, plus an overlay tagging nodes preferred / tentative / contested, recency-weighted, with provenance, and automatically invalidated when the underlying code moves on. The signal is not a learned reward or an opaque score: it is the declared outcome of a specific query.
Consumption goes through an MCP server, over stdio and Streamable HTTP, with typed tools: query_graph, get_node, get_neighbors, shortest_path, list_prs, get_pr_impact, triage_prs. It binds to 127.0.0.1 by default; exposing it requires --host 0.0.0.0 and --api-key. Good.
The wrong row of the table
This is where the article gets uncomfortable, and I want one thing on the record first: Graphify publishes a better benchmark than 95% of its sector. Reproducible harness, judge validation with two independent judges (90.6% agreement, Cohen’s kappa 0.81) and a per-run spend ledger. That deserves credit, because the norm in this market is a bar chart with no methodology.
The problem is not the benchmark. It is how the benchmark gets read.
The README headlines against mem0, which scores 0.048 recall@10 on LOCOMO. That is where the “10x” reproduced across half the tech press comes from. But the honest baseline is in the same table, three rows up: a classic hybrid RRF — BM25 plus dense, fused with reciprocal rank fusion — run on the same harness.
Recall@10 on LOCOMO (n=300):
| System | recall@10 |
|---|---|
| graphify | 0.497 |
| hybrid RRF | 0.493 |
| dense RAG | 0.439 |
| BM25 | 0.362 |
| supermemory | 0.149 * |
| mem0 | 0.048 |
* the document itself flags this value as confounded by its own embedder.
Four thousandths. Under one percentage point over well-executed hybrid retrieval — which is exactly what you have been assembling since 2023 with two libraries and an afternoon.
And there is a second row that even the standard critical read misses. On the QA metric — answering the question correctly, not just retrieving the document — Graphify scores 45.3% against the hybrid’s 43.3%. But supermemory scores 49.7%, above Graphify, with that 0.149 recall its own embedder confounds. In other words: the system with the worst retrieval in the table answers questions best. That does not invalidate Graphify, but it says something almost nobody is saying out loud: on LOCOMO, recall@10 and answer quality are far less correlated than we all assume.
Two more reading warnings. First, the category: LOCOMO and LongMemEval-S measure conversational memory, not code comprehension. The only code-intelligence evidence in the repo is ERPNext, where key-fact coverage rises from 70.8% to 82.0%… over n = 6 questions. That is a well-instrumented anecdote, not a measurement. Second, the judge: the model that reads and the model that scores are the same one, Kimi K2.6, and reproducing the harness requires MOONSHOT_API_KEY — that is, traffic to Moonshot AI servers in China. It does not affect using the tool, but it does block independent reproduction in any environment with data-residency constraints unless you swap the judge first. And date the citation: BENCHMARKS.md has not been updated since 5 July 2026.
What the evidence does support solidly is something else, and it is what genuinely differentiates the project: cost and scale. LOCOMO ingest at ~$1.40 against supermemory’s $15.67 (roughly 11x less), with graph construction at 0 LLM credits. And 689 weekly ERPNext checkpoints from 2011 to 2026 showing the graph growing from 3,069 to 22,620 nodes and from 2,900 to 48,710 edges, with AST extraction stable all the way.
Graphify’s differentiator is not accuracy. It is that indexing costs no money and every edge knows where it came from.
The 71.5x has a full curve, and it is published
The other number circulating on its own is token savings. “71.5x less context per query.” It is true, and it comes from one specific corpus. The documentation publishes the whole curve, and it is honest:
| Corpus | Files | Token reduction |
|---|---|---|
| Karpathy repos + papers + images | 52 | 71.5x |
| graphify source + Transformers paper | 4 | 5.4x |
| httpx (synthetic library) | 6 | ~1x |
The correct reading is that the benefit is a function of corpus size and heterogeneity, not a property of the tool. Below roughly 50 files, what you gain is structural clarity, not compression. And in the repo’s own ERPNext code benchmark, the declared cost is still ~140,000 tokens per query: cheap next to injecting the whole repository, less so next to a well-aimed grep.
Provenance is not truth
This is, for me, the conceptually most interesting part of the design — and also its most instructive failure.
Every edge carries a confidence tag on a discrete rubric, not a continuous score:
EXTRACTED= 1.0 — explicit in the source code.INFERRED= 0.95 / 0.85 / 0.75 / 0.65 / 0.55 — five fixed steps, each with its own criterion.AMBIGUOUS— flagged for human review.
I will take this over a confidence: 0.7834 falling out of a softmax any day. A discrete rubric can be audited; an opaque continuous number cannot.
But there is a trap, and it is well documented. EXTRACTED = 1.0 guarantees that the edge was read from source. It does not guarantee that the relation name is correct. MikeWang documented the clearest case on 7 August: a Swift enum Event: String, where String is the enum’s raw value type and not a superclass, was modelled as Event --inherits--> String and tagged EXTRACTED, at maximum confidence. In Swift’s syntax tree, enum Event: String is structurally identical to class Foo: Bar. And it means something completely different.
Tree-sitter read the syntax perfectly. Graphify hung the wrong label on it. And the confidence system has no way of knowing, because it measures the provenance of the fact, not its interpretation. Wang puts it well himself: the tag guarantees the edge was read rather than guessed; it does not guarantee the relationship name is right. Worth noting, incidentally, that his review is favourable overall — the enum case appears as a well-bounded limitation, not as a wholesale objection.
This applies to any provenance-based confidence system, not just Graphify: knowing where a fact came from and knowing that the fact is correct are two different problems, and conflating them is comfortable precisely because the first is easy to instrument and the second is not.
The order of a priority list is a data-policy decision
Now the finding that raised my eyebrow the most.
When you run graphify extract without passing --backend, the tool resolves the model provider by looking at which environment variables you have set, in this order:
Gemini → Kimi → Claude → OpenAI → DeepSeek → Azure → Bedrock → OllamaTwo consequences, and neither is an implementation detail.
One: Ollama — the only fully local option of the eight — is last. On a real developer machine, where almost everyone has three or four API keys in their profile for reasons entirely unrelated to this, Ollama is the least likely to fire. The tool marketed as local-first only is if you ask for it explicitly.
Two: Kimi is second on the list, and the documentation itself warns — in plain words — that MOONSHOT_API_KEY routes to Moonshot AI servers in China. Which means a developer with that key exported for some unrelated reason, running graphify extract without --backend over a client’s documentation, would be shipping it out without a single conscious decision.
This is not a vulnerability. It is a default. And that is exactly the point: the order of a fallback list is not an engineering decision, it is a data-policy decision, and almost nobody reviews it as one. True for Graphify, true for anything that resolves providers from environment variables.
The control is trivial, mind you: forbid invocation without an explicit --backend and pin it in project config. For anything touching client data, --code-only or --backend openai pointed at your own inference (llama.cpp, LM Studio, vLLM — the backend accepts any OpenAI-compatible endpoint, and that piece is what makes a fully self-hosted deployment viable).
The problem nobody had attacked: the assistant ignores the graph
There is one detail in Graphify that gives away a team that has actually used this thing.
You can build the world’s best graph, expose it over MCP with seven perfectly typed tools… and watch the assistant ignore it and open files anyway. Alex Rusin documented it in July: Claude Code repeatedly bypassed the graph and went back to reading sources.
Graphify’s answer is not documentation or a longer prompt. It is coercion: platform-specific PreToolUse hooks and a --strict mode that blocks the session’s first raw source read and redirects it to the graph. After that first time, it falls back to nudging.
It is an ugly solution and it is the right one. If your tool competes against an ingrained habit of the model, availability is not enough; you need an interruption. I think the pattern generalises to anyone building tools for agents: adoption by the model is a design problem, not a documentation problem.
What an AST cannot see
It is worth being precise about scope, because “code knowledge graph” sounds like more than it is.
Graphify models static structure: calls, imports, inheritance, cross-layer references. The index is a snapshot of the syntax tree at one commit. What it does not model is real execution flows: what actually runs, in what order, how often, under what conditions. The static call map and the execution topology are two different problems, and the second does not follow from the first.
What the static map is good for: orienting yourself fast in a system nobody on the team knows, unifying application code with database schema and Terraform infrastructure into one queryable space — “what connects this API route to this table and this deployed resource” has no cheap alternative — and estimating blast radius before a migration.
What it is not good for: replacing verification against source. The confidence tag does not validate the relation name, as we have seen.
Documentation drift runs in both directions
A note on rigour, because this usually gets told in one direction only.
Graphify’s documentation has measurable drift: the supported-language count varies between 25, 37 and “~40” depending on which page you open — the traceable, correct figure is 37 tree-sitter grammars, the one in the README’s format table — and SECURITY.md still names the 0.3.x series and claims graph analysis makes no network calls. Do not use it as a data-flow inventory.
But here is the interesting part, and it is something almost every critical piece I have read gets backwards. The README says in one place that every query is logged to ~/.cache/graphify-queries.log with an opt-out. That is no longer true: since issue #1797 the log is opt-in via GRAPHIFY_QUERY_LOG_ENABLE=1, off by default, and the README line is stale text. In other words, this project’s documentation drift also runs against the project: the docs attribute worse behaviour to it than it actually has.
For the record. Verifying on disk is still the right answer, but repeating the old version would be an error in the opposite direction to the usual one.
What is simply good, no caveats
So as not to leave the wrong impression, because there are things here other projects should copy outright:
- Supply chain. Published via Trusted Publishing with Sigstore attestations verifiable per tag. The 0.9.48 certificate carries the SAN of the workflow that built it. Being able to cryptographically verify an artifact’s provenance is still rare.
- A permissive, frictionless licence — with one ambiguity to resolve in writing before vendoring code into a deliverable: the repo carries
LICENSE(Apache-2.0) andLICENSE-MIT, while PyPI declares Apache-2.0. - The graph version-controlled in git. Making the artifact live in the repository and get reviewed in a PR is the decision that turns this into infrastructure rather than a desktop toy.
And the warning signs, unvarnished: pre-1.0 at four months old, near-daily release cadence, 497 open issues and 537 open PRs, a single package maintainer on PyPI, and Bandit and pip-audit running with continue-on-error in CI — meaning static security findings are advisory, not a quality gate. Do not assume a gate exists where there is none.
My verdict
The pattern, yes. The dependency, not yet. Again.
There are four ideas here you can lift into your own system today without inheriting anything: per-edge provenance on a discrete rubric instead of a continuous score; first-class hyperedges for n-ary relations; step-level reflection with a working-memory overlay and automatic invalidation when the source moves; and hook-based agent coercion for when availability is not enough. None of them needs Graphify to exist. On a knowledge-graph project of my own I ran into the first three as open gaps, and seeing a concrete design that solves them at 48,000-edge scale is worth more than the software.
As an internal tool, --code-only is a zero-cost, zero-network, zero-exposure pilot. uv tool install "graphifyy==0.9.48", pin the version, run graphify extract . --code-only over a real repository, and measure against a blind set of twenty questions whose answers you already know and can verify against source. That measurement is worth infinitely more than anyone else’s benchmark.
As a dependency in something you deliver to a client: no, not yet. And backend auto-detection by default: forbidden anywhere with data-residency commitments.
What I cannot get out of my head is the four-thousandths row. A project publishes an honest benchmark, with its methodology, its judge validation and its spend ledger — and chooses to headline against the weakest competitor in the table, with the serious baseline sitting three rows up. The conclusion is not that Graphify cheats: it is that the benchmark is good enough to be read against the people who published it, and reach a different conclusion without leaving the document. If only that were the rest of the sector’s problem.
Ideas over code; evidence over hype.
Sources
- Graphify-Labs/graphify — README, repository metrics, licences, backend auto-detection order
- ARCHITECTURE.md — pipeline, extraction schema, confidence labels
- BENCHMARKS.md — LOCOMO, LongMemEval-S, ERPNext, harness and judge validation (upd. 5 Jul 2026)
- docs/how-it-works.md — three passes, Leiden, confidence rubric, token benchmark
- SECURITY.md — security policy (stale, 0.3.x series)
- PyPI — graphifyy — release history, SPDX, Sigstore attestations, maintainer
- graphify.com — official site, Enterprise layer, adoption cases
- Wavect — CTO review (K. Riedl, 16 Jul 2026) — documentation drift and benchmark limits
- Alex Rusin — field review (13 Jul 2026) — the assistant bypasses the graph
- MikeWang — “Let Claude See Your Project First” (Medium, 7 Aug 2026) — wrong relation labels tagged EXTRACTED
- Rootly-AI-Labs/rootly-graphify-importer — public adoption case

Leave a Reply